
Support for Crypto Regulation and Pro-Crypto Political Candidates
The XandY Poll | U.S. National Adult Population | Nov. 2023
Abel Gustafson, Matthew Goldberg, & Carly Wolfer
July 2024
Some of the most important developments in blockchain and crypto are happening on Capitol Hill, not in Silicon Valley. Lawmakers and regulatory agencies have been hashing out policies for the stance that the U.S. government takes toward taxation, oversight, and public safety. In democratic societies, lawmakers tend to be influenced by the desires of their constituents, so public opinion of policies is an important lever. Here, we summarize findings from The XandY Poll that show how much Americans support or oppose different regulatory approaches the U.S. government could take, as well as how voters view pro-crypto political candidates.
Americans Lean Toward Stricter Regulation As Well As Easier Access
As shown in the figure below, about half of U.S. adults (53%) either “strongly” or “somewhat” support the government imposing stricter regulation on crypto trades and transactions. A similar proportion supports stricter regulations on the development of new blockchain technologies. About 1 in 5 American adults oppose these types of regulations, and the rest say they are unsure.

Despite this prevalent desire for more regulation, the figure below shows that many Americans (41%) still want crypto to be made more accessible to everyday people, while far fewer oppose this (27%). This seems paradoxical because it appears that many Americans want both more regulation and easier access. Such situations are common in the early stages of emerging technologies. People tend to crave safety and security but simultaneously want all the benefits that the new innovation could hold.
Findings like this suggest that Americans’ desires for stricter regulation are usually not caused by opposition to crypto and blockchain technologies. Instead, they are probably driven by desire for more safety and security while still accessing and using crypto. In some ways, this is a positive signal (people want to use it, but they just want safety and confidence), and requires more research into the nuances of Americans’ policy preferences.

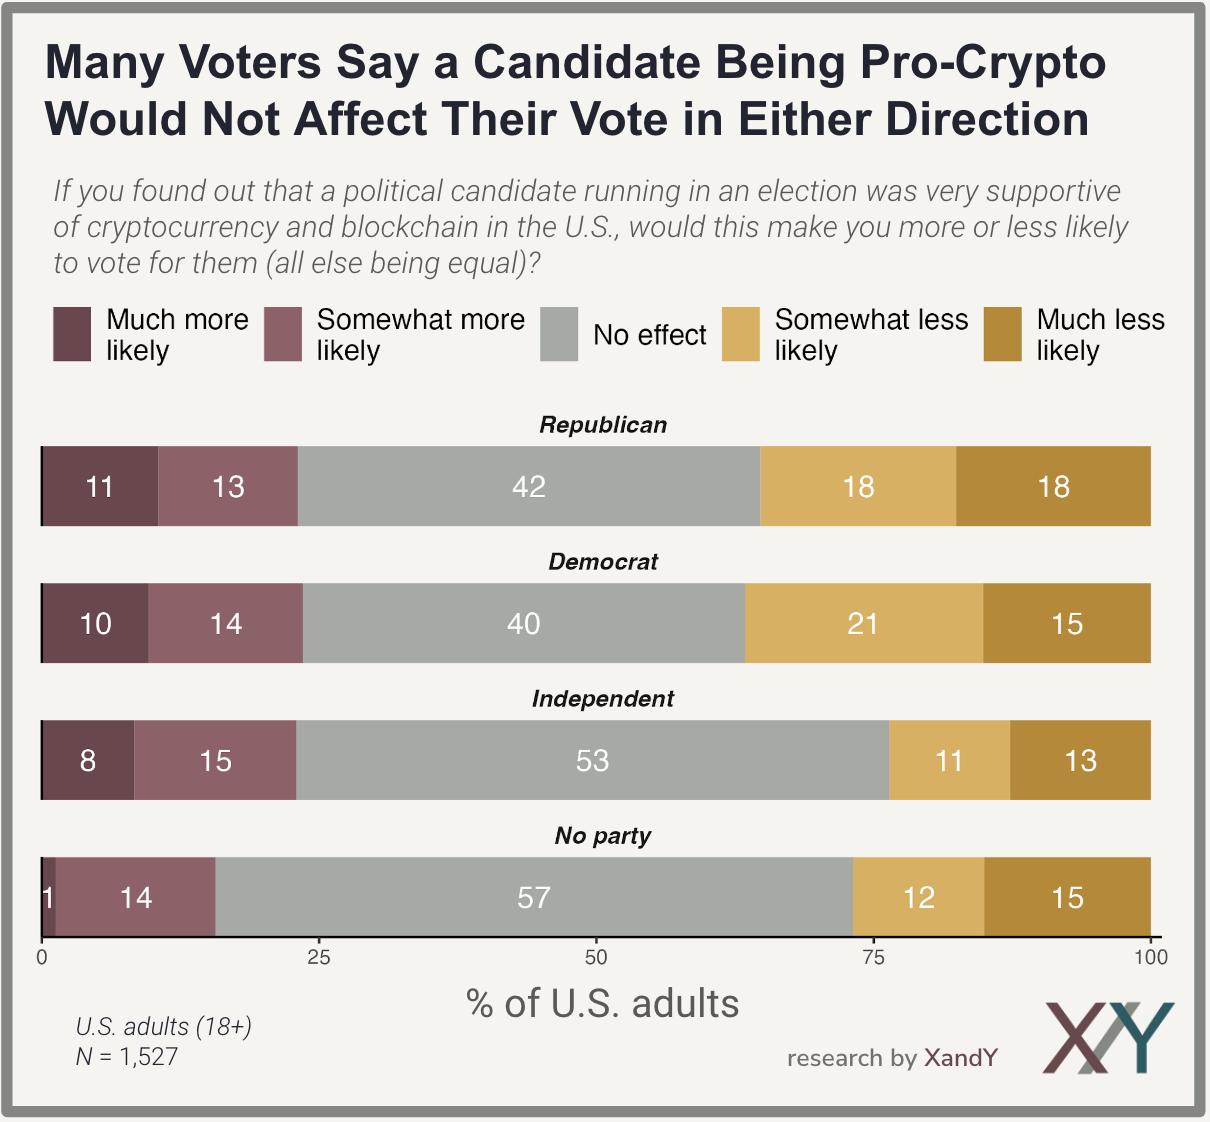
Most Voters Are Not Turned Off by Pro-Crypto Candidates
Another important aspect of crypto political sentiment is how a pro-crypto platform would affect a candidate’s favorability with voters. As shown below, our poll finds that the most common response across the political spectrum is that a candidate’s pro-crypto position would have no effect on their vote. The distribution of responses is nearly identical for both Republicans and Democrats, and Independents are even more likely to say “no effect.” A minority of Americans (around 1 in 3) say this would make them less likely to vote for the candidate, and around 1 in 4 say it would make them more likely to vote for them.
So What
Across both of these survey questions (policy support and voting likelihood), we see that many Americans are cautious and desire safety, but a large portion are also undecided or unsure. This lack of strong, solidified opinions is a clear opportunity for communication campaigns that can tip the large swath of “Unsure” and “No effect” groups toward more positive sentiment.
Further, the lack of political polarization is encouraging. That is, unlike many other issues, we do not see a strong divide between political parties on preferences for crypto regulation. This presents a rare opportunity for building bipartisan coalitions and enacting policy that is supported across the political spectrum.
About The XandY Poll
Survey Methodology
The design, data collection, analysis, and reporting of this national survey were performed by XandY, an independent research and strategy firm. Exhaustive details of the scientific methodology of The XandY Poll can be found here. The following briefly summarizes key points of interest.
The survey responses were fielded from November 18 – November 21, 2023 using online recruitment methods to sample adult residents of the United States (N = 1,527). This survey used a nested quota sampling strategy to match U.S. Census proportions of age, income, race and ethnicity, gender, and political party affiliation. To further ensure the insights reported from these data closely resemble the U.S. population, the sample was weighted to match U.S. Census benchmarks.
Percentage points are rounded to the nearest whole number. When sums of two proportions are reported in text (e.g., “63% of U.S. adults say they either “strongly” or “somewhat” support…") we round the total value after summing. Sometimes, this creates an apparent error. For example, 41.4% + 20.4% = 61.8% which rounds to 62%. But in the figure, the values are individually rounded (41% and 20%) so it might appear that 41% + 20% = 62%.
Margin of Error
Proportion statistics regarding the full national sample have an average margin of error of +/- 2 percentage points at the 95% confidence level. The margin of error in subgroups is determined by the subgroup size.
Citation
This paper and the insights it reports may be cited as:
Gustafson, A., Goldberg, M. H., & Wolfer, C. (2024). Support for Crypto Regulation and Pro-Crypto Political Candidates. XandY. New Haven, CT. Retrieved from: https://www.xandyanalytics.com/support-crypto-regulation-and-candidates